MANTA improves accuracy, completeness, effectivity, and automation to your Collibra-based data governance solution.
With MANTA, there is no need to worry about end-to-end data lineage to support your BASEL, CCAR, or GDPR projects because MANTA extracts technical metadata from all the databases, scripts, stored procedures, and other kinds of data processing logic in your BI environment and feeds them into Collibra so you don’t have to analyze them manually.
Why do you need data lineage in Collibra?
Because accurately documented data linage is an important source of eff ectivity in BI. It is needed for daily work as it describes business and data processing logic in a company. Data lineage is also a must-have to comply with several regulations (like BCBS or GDPR).
But Collibra already supports data lineage. So what is the difference with MANTA?
Collibra provides great features here, but any data governance solution, including Collibra, is only as good as the metadata in it. And this is where MANTA helps – brings technical metadata to Collibra in an automated way.
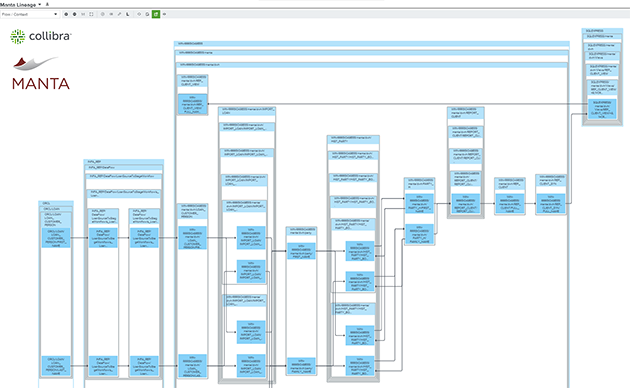
Data lineage provided by Manta in Collibra’s native visualization (click here to open a larger image in a new tab)
Why should we care about automation when we can get our developers and analysts to document metadata manually?
Because the manual approach is labor intensive, time consuming, and error-prone. Your guys have better things to do than manually document every detail of the logic hidden inside the millions of lines of data processing code they develop. MANTA is a better way.
But Collibra reads metadata from our databases. How does MANTA differ?
There are two critical pieces to any data environment – structures (like files, database tables, columns, and associated business entities) and logic (programs, applications, ETL workfl ows). MANTA does what others can’t – brings metadata from your business and data processing logic to Collibra.
MANTA and Collibra are best when served together.
- Learn about other technologies MANTA supports
- Try our technical lineage demo at getmanta.com/demo
- Get a personal presentation and ask for a free trial at manta@getmanta.com

